Dapper in System Design

We will explore what is Dapper, key concepts in Dapper and how Dapper is used in System Design.

Table of contents:

  1. Introduction to Dapper
  2. Design Principles
  3. Distributed tracing in Dapper
  4. Trace collection process
  5. General purpose Dapper tools
  6. Usage of Dapper

Introduction to Dapper

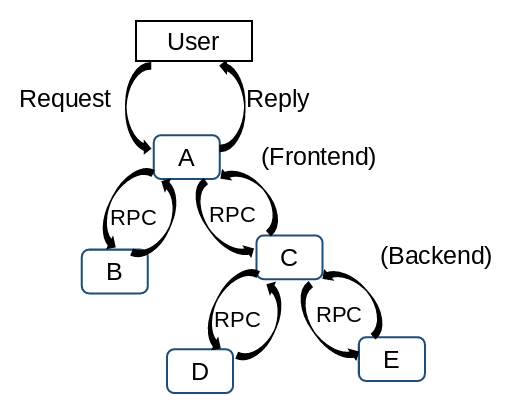
Dapper is a distribution tracing solutions developed by Google to provide their developers with more information about the behavior of complex distributed systems. Distributed systems are difficult to observe, not all problems could be pinpointed based on logs and statistics. For instance, a simple search query through the frontend server will be sent to multiple servers in the backend for processing. This include searching within its own index, specific category of results such as images, news, video and retrieving related advertising. One of these servers in the backend could be performing poorly which result in the delay in the overall response. It would be hard to pinpoint which service is causing the issue and the reason behind it.
path-taken

Design Principles

These three design principles seek to fulfill the Ubiquitous deployment and continuous monitoring requirements of Dapper.

Low overhead
In order to ensure the application team uses the tracing system, there should be negligible performance impact on the running services.

Application-level transparency
The tracing system should minimize the intrusive modifications in order to fulfil the ubiquity requirement.

Scalable
The tracing system should be able to scale with the growth of the applications over the next few years.

Distributed tracing in Dapper

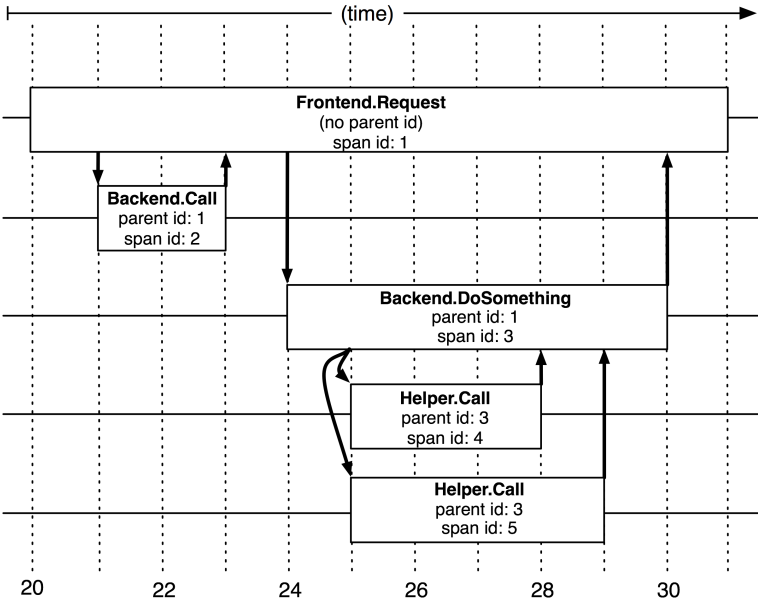
Dapper traces is modeled using trees, spans and annotations. Spans are the basic unit of a Dapper trace tree. For each span, there is a human-readable span name, span-id and parent id. In a Dapper trace, there usually is a single span for each remote procedure call (RPC) and each level of infrastructure translate to an additional level in the trace tree.

The application team performing the Dapper trace could marked the trace with its own annotation. It can include value such as time stamps to help to analyze the time consumed at the application service level. It can also be other value or data which can help to investigate an incident.

Whenever a thread processes a traced control path, Dapper insert the trace context to the thread local storage. Trace context is a small, easy to copy container of trace id and span id
trace-tree

Dapper trace tree (Dapper a Large-Scale Distributed Systems Tracing Infrastructure, Google Technical Report dapper 2010)

Trace collection process

The logging process is divided into three steps. Firstly, the Span data is written to a local log file. Secondly, Dapper collectors daemon retrieve them from the production host machines. Lastly, the Collectors record the trace to a single Bigtable repository.

Instead of using Dapper, an alternative is to use RPC to collect information in the interface. However they are unable to handle non-nested distributed execution patterns such as asynchronous processes.

General purpose Dapper tools

Depot API
The Dapper Depot API (DAPI) provide directed access to the raw data contained within the Dapper trace repositories. Access can be performed via unique trace id or bulk access by leveraging on MapReduce. It maps frequently requested trace features to unique dapper traces utilizing indexed access.

Dapper user Interface
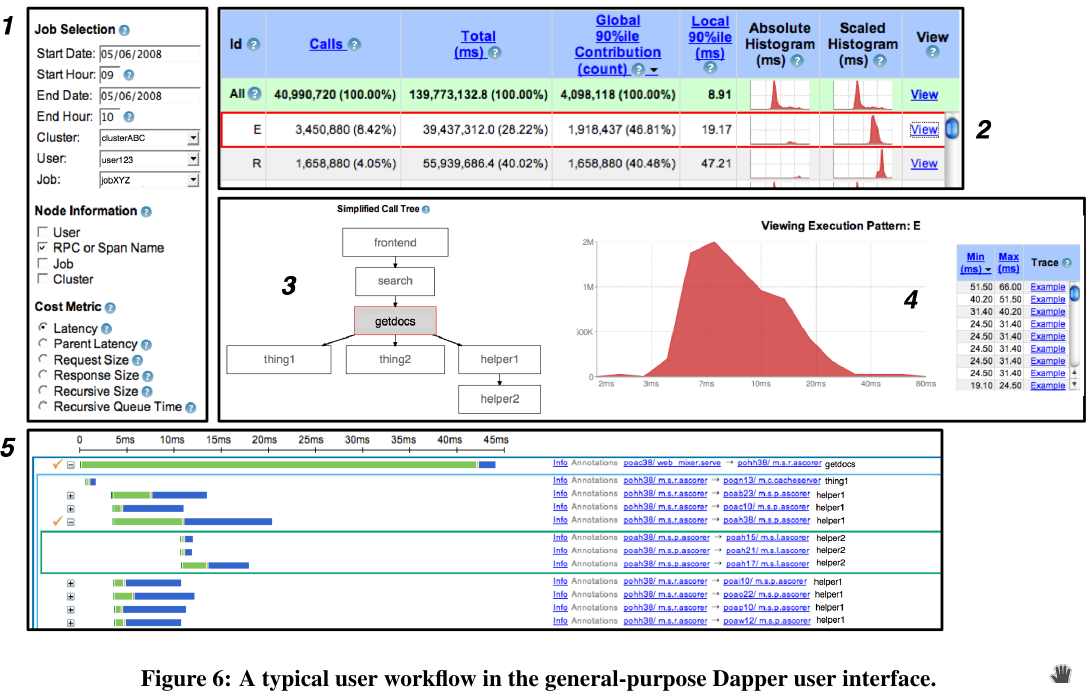
Using the web-based user interface, the user selects the service, time window and the relevant metric value (such as time delay) for their investigation. A table of all performance summaries that meet this condition pattern will be retrieved. Next, the user can select a single distributed execution pattern for further examination. It will show the detailed timestamp distribution of the selected trace. user-interface Dapper user interface (Dapper a Large-Scale Distributed Systems Tracing Infrastructure, Google Technical Report dapper 2010)
Usage of Dapper

Some example of Dapper usage are as follow. Dapper can be used during development to track progress against a latency target and identify optimization opportunities. In terms of addressing long tail latency, Dapper is able to validate critical path for universal search request and provide data to conclude performance issues.

Using Dapper core instrumentation and the trace annotations, we were able to infer service dependencies between individual jobs and software infrastructures.

Dapper can be used to provide information with regards to the network usage of different services. The Dapper user interface can group and consolidate trace performance information across layered and shared storage systems.

Firefighting with Dapper can performed during catastrophic failure or services that experience high latency during normal workload. This is done by accessing the Dapper daemon directly to gather and look at fresh data to identify the root causes.

This article was originally published at OpenGenus:

link to my article at OpenGenus

Hadoop in System Design

We will explored the idea behind Hadoop and how it is used in System Design.

Table of contents:

  1. Introduction to Hadoop
  2. Big Data and its challenges
  3. Hadoop as a solution
  4. Components of Hadoop
  5. Hadoop vs Relational database management system (RDBMS)
  6. Use case of Hadoop

Introduction to Hadoop

Hadoop is a framework of open-source software utilities that processed data in parallel while managing Big Data storage in a distributed way. Hadoop is able to efficiently break up Big Data processing across multiple commodity computer (DataNodes) and then combine the results.

Big Data and its challenges

Big Data are massive amount of data which cannot be stored, processed and analyzed using the traditional ways like a Relational Database Management System (RDBMS). Big Data include Structured data (such as database, spreadsheets), Semi-structured data (emails, html pages, etc) and Unstructured data (messages posted on social network such as Twitter, images, videos,etc). Volume, Velocity, Variety, Value, Veracity are the “5Vs” of Big Data which are also termed as the characteristics of Big Data.

In the early days, there are only limited data to store and processed. For instance, structured data such as database require only one processor unit and one storage unit. SQL was used to query database and the data were neatly stored in rows and columns like an excel spreadsheet. As the rate of data generation increased in recent years, it result in high data volume with different data format. The current single processor and single central storage unit model became the bottleneck.

Hadoop as a solution

The single processor was not enough to process such high volume of different kind of data as it was very time consuming. Due to the single storage unit acting as a bottleneck, network overhead was produced.

Hadoop enabled parallel processing with distributed storage. Large amounts of data were processed quickly by using many processors. Each processor makes use of distributed storage. Data storage and access are made simple by this. Since there was no need to wait for the data to be pulled or processed, Hadoop operated without creating network overhead or a bottleneck.

Components of Hadoop

There are three components of Hadoop. The Hadoop Distributed File System (HDFS), MapReduce and Yet Another Resource Negotiator (YARN).

Hadoop Distributed File System (HDFS)

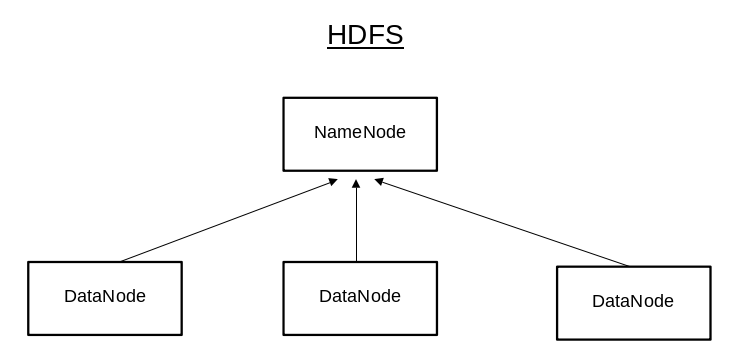
HDFS is the storage unit, it contain a Single NameNode and multiple DataNodes. The NameNode maintain and manage the DataNode and the DataNodes store the actual data, it perform the reading, writing, processing and replication of data. This replication of data among the DataNodes is how the Hadoop framework handle the DataNode failures.

Datanode sent a Heartbeat (a signal) every 3 seconds to the Namenode to indicate that it is alive. If there is an absence of heartbeat for a period of 10 minutes, a ‘Heartbeat Lost’ condition occurs and the corresponding DataNode is deemed to be dead/unavailable. HDFS

MapReduce

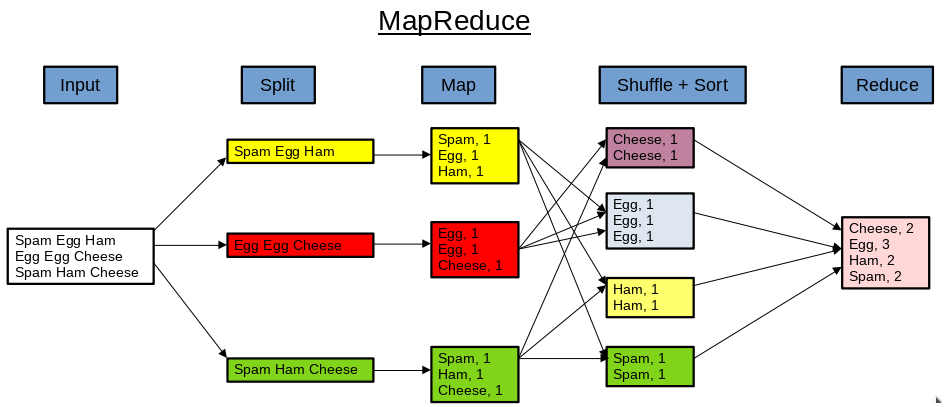
MapReduce is the processing unit, it is a Programming Algorithm where huge data is processed in a parallel and distributed manner. The application is divided into many small fragments of work, the processing is performed at the DataNodes and the result is sent to the NameNode.

The input data is first split into chunks of data. Next the chunks of data are processed in parallel by map task. It is then sorted and label with the occurrence number. At the reduce task, aggregation take place and the output is obtained. MapReduce

Yet Another Resource Negotiator (YARN)

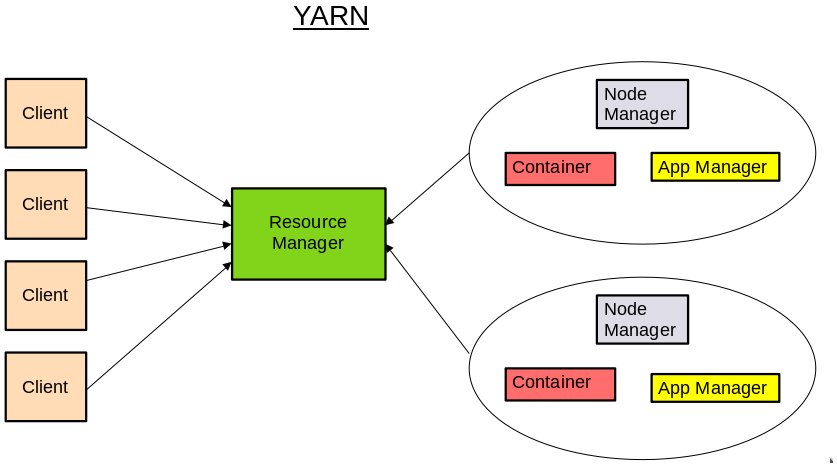
YARN is the resource management unit of Hadoop. Its acts as an operating system to the Hadoop framework and performs the management of cluster resources and job scheduling. The workflow is as follow:

  1. When the clients submit the MapReduce jobs, it get sent to the Resource manager.
  2. The Resource manager is responsible for resource allocation and management. Here the Resource manager allocate a Container (a collection of physical resources such as CPU and RAM) to start the Application Manager.
  3. The Application Manager register with the Resource manager and request containers from the Node Manager (manages the nodes and monitor resource usage).
  4. Application code is executed in the Container.
  5. Once the processing is complete, the Application Manager deregister with the Resource Manager. YARN

Hadoop vs RDBMS

The first difference is the schema on read approach by Hadoop and schema on write approach by RDBMS. In Hadoop, there is no restriction of what kind of data get to be stored in the HDFS. Rather than preconfiguring the structure of data, the application code will configure the data when the application read it. This is in contrast to the schema on write approach by RDBMS. Before inputting data into the database, we need to find out the database structure, modify the data sturcture so that it meet the data types the database is expecting. The database will reject the data if it does not conform to what it is expecting.

Second difference is that data in Hadoop is a compressed text file or other data types and it is replicated across multiple DataNodes in the HDFS. Whereas in RDBMS, the data is stored in a logical form with linked tables and defined columns.

Lastly, let assume that there are DataNode failure in Hadoop resulting in incomplete data set. In this instance Hadoop would not hold up the response to the user. It would provide the user an immediate answer and eventually it would have a consistent answer. The eventual consistency methodology in Hadoop is a better model for reading continuously updating feeds of unstructured data across 1000’s of servers.

On the other hand, RDBMS take a two phase commit approach. RDBMS must have complete consistency across all the nodes before it release anything to the user. The RDBMS two phase commit methodology is well suited for managing and rolling up transactions, so we know we got the right answer.

Use case of Hadoop

Lets take the “satellite view” of Google Maps as an example. How can large amount of image data files (different quality and taken at different period in time) from various content provider (input) be processed into the “satellite view” for users.

First divide the entire region into many smaller “grids” assign with fixed location IDs (latitude and longitude are useful unique IDs). Split the image data files into smaller tiles according to the “grids” they cover. Secondly, Map the smaller image with the image filename (key) and the corresponding image data (value).

Next, we Sort the image data according to their timestamp (date captured) and quality (resolution). Finally, we Reduce by overlapping and merging similar image data in the same grid they occupy. The output after using MapReduce to process the large amount of image data files will be the “satellite view” of Google Maps.

This article was originally published at OpenGenus:
link to my article at OpenGenus

Python script to control keyboard

We will create a Python script to control the keyboard by simulating key combinations and typing.

Table of contents:

  1. Introduction to PyAutoGui
  2. write() function
  3. press() function
  4. keyDown() and keyUp() function
  5. hold() function
  6. hotkey() function
  7. Keyboard keys attribute
  8. Simulate typing

Introduction to PyAutoGui

PyAutoGui is a Python module for automation with the Graphical User Interface (GUI). It can be used to programmatically control the keyboard. To install just run the following command in the terminal.

pip install pyautogui

write() function

The pyautogui.write() function will simulate the user typing a string of text on the keyboard. We can also specify the time delay after each character is type.

import pyautogui
import time

# 5 seconds cooldown to allow user to terminate the program by moving the mouse to one of the 4 corners
time.sleep(5)
# make the text editor window active
pyautogui.click(300,1060)
pyautogui.write("# Hello world!",0.25)

press() function

Using the pyautogui.press() function, we can simulate the user pressing specific key on the keyboard. pyautogui.press(['right', 'right']) is equivalent to pressing the right arrow twice. pyautogui.press('\t') has the same result as pressing the Tab key once on the keyboard.

import pyautogui
import time

# 5 seconds cooldown to allow user to terminate the program by moving the mouse to one of the 4 corners
time.sleep(5)
# make the text editor window active
pyautogui.click(300,1060)
pyautogui.press(['right', 'right'])
pyautogui.press('\t')

keyDown() and keyUp() function

The pyautogui.keyDown('shift') has the same effect as holding down the shift key on the keyboard and the pyautogui.keyUp('shift') function will released the shift key. The output on the text editor will be @2 instead of 22.

import pyautogui
import time

# 5 seconds cooldown to allow user to terminate the program by moving the mouse to one of the 4 corners
time.sleep(5)
# make the text editor window active
pyautogui.click(300,1060)
pyautogui.keyDown('shift')
pyautogui.press('2')
pyautogui.keyUp('shift')
pyautogui.press('2')

hold() function

We can achieve the same result as above by using pyautogui.hold('shift') function.

import pyautogui
import time

# 5 seconds cooldown to allow user to terminate the program by moving the mouse to one of the 4 corners
time.sleep(5)
# make the text editor window active
pyautogui.click(300,1060)
with pyautogui.hold('shift'):
    pyautogui.press('2')
pyautogui.press('2')   

hotkey() function

A common use of the hotkey() function is to simulate the copy (ctrl + c) action on the keyboard. Without using the hotkey() function, we need to make use of the keyDown(), keyUp() function written in example below.

import pyautogui
import time

# 5 seconds cooldown to allow user to terminate the program by moving the mouse to one of the 4 corners
time.sleep(5)
# make the text editor window active
pyautogui.click(300,1060)
pyautogui.keyDown('ctrl')
pyautogui.keyDown('c')
pyautogui.keyUp('c')
pyautogui.keyUp('ctrl')

By using the hotkey() function, the code can be simplified as the example below.

import pyautogui
import time

# 5 seconds cooldown to allow user to terminate the program by moving the mouse to one of the 4 corners
time.sleep(5)
# make the text editor window active
pyautogui.click(300,1060)
pyautogui.hotkey('ctrl', 'c')

Keyboard keys attribute

The following key strings can be passed to the press(), keyDown(), keyUp() and hotkey() functions.

Key strings Explanation
'0', '1', '2', ..., 'A', 'a', 'B', 'b', ..., '!', '@', '#', ... numbers, alphabets, punctuation and symbol keys
'enter', '\n', 'return', '\r' Enter Key
'\t' Tab key
'esc' Esc key
'shift', 'shiftleft', 'shiftright' Shift key
'ctrl', 'ctrlleft', 'ctrlright' Ctrl key
'alt', 'altleft', 'altright' Alt key
'delete' Delete key
'backspace' Back Space key
'pageup', 'pagedown' Page Up, Page Down key
'up', 'down', 'left', 'right' ↑ ↓ ← → key
'f1', …, 'f12' F1 to F12 key
'capslock', 'numlock', 'scrolllock' Caps lock, Num Lock, Scroll Lock key

Simulate typing

In the example below, we simulate typing by using function provided by the pyautogui module. The time module is imported for our time.sleep() function. Lastly, the pathlib module provide the function to open and read the content of our text file.

import pyautogui
import time
from pathlib import Path

The time.sleep() function provide a cooldown period to allow the user to terminate the python script.

# 5 seconds cooldown to allow user to terminate the program by moving the mouse to one of the 4 corners
time.sleep(5)

We use the .read_text().splitlines() function from the pathlib module to assign every new line of text into the list variable (quotes). Next the pyautogui.click() function is used to make the text editor window active.

data_folder = Path("data/")
file_to_open = data_folder / "pangram.txt"
quotes = file_to_open.read_text().splitlines()

# make the text editor window active
pyautogui.click(300,1060)

In the below codes, we iterate through every items (type strings) in our list variable (quotes). We use pyautogui.write() to simulate typing of every item in our list variable followed by pyautogui.press(\n) to input a new line.

If it is an empty string (i.e. paragraph spacing), pyautogui.write() will have nothing to type and pyautogui.press(\n) will input a new line, simulating a new paragraph spacing.

for item in quotes:
    pyautogui.write(item)
    pyautogui.press('\n')

Here is the entire code block for reference

import pyautogui
import time
from pathlib import Path

# 5 seconds cooldown to allow user to terminate the program by moving the mouse to one of the 4 corners
time.sleep(5)

data_folder = Path("data/")
file_to_open = data_folder / "pangram.txt"
quotes = file_to_open.read_text().splitlines()

# make the text editor window active
pyautogui.click(300,1060)
for item in quotes:
    pyautogui.write(item)
    pyautogui.press('\n')

Content of the pangram.txt file is listed below for your reference, you may copy it to try out the above python script that simulate user typing on the keyboard.

Pangrams - a unique sentence in which every letter of the alphabet is used at least once. The name comes from the Greek root words pan, meaning all, and gram, meaning something written or recorded. Consider the following examples.

1. Waltz, bad nymph, for quick jigs vex. (28 letters)
2. Quick zephyrs blow, vexing daft Jim. (29 letters)
3. Sphinx of black quartz, judge my vow. (29 letters)
4. Two driven jocks help fax my big quiz. (30 letters)
5. Five quacking zephyrs jolt my wax bed. (31 letters)

6. The five boxing wizards jump quickly. (31 letters)
7. Pack my box with five dozen liquor jugs. (32 letters)
8. The quick brown fox jumps over the lazy dog. (35 letters)
9. Jinxed wizards pluck ivy from the big quilt. (36 letters)
10. Crazy Fredrick bought many very exquisite opal jewels. (46 letters)

11. We promptly judged antique ivory buckles for the next prize. (50 letters)
12. A mad boxer shot a quick, gloved jab to the jaw of his dizzy opponent. (54 letters)
13. Jaded zombies acted quaintly but kept driving their oxen forward. (55 letters)
14. The job requires extra pluck and zeal from every young wage earner. (55 letters)

This article was originally published at OpenGenus:
link to my article at OpenGenus

Container With Most Water [LeetCode]

You are given an integer array height of length n. There are n vertical lines drawn such that the two endpoints of the ith line are (i, 0) and (i, height[i]). Find two lines that together with the x-axis form a container, such that the container contains the most water. Return the maximum amount of water a container can store. Notice that you may not slant the container. link to problem on LeetCode

My attempt on the problem

The further the lines are apart (width), the greater the size of the container (area) will be. The area form under the line will be limited by the shorter line (height)

I will use 3 variables to keep track of the current max area, left and right pointers. The left pointer initialized to the first elements of the list and the right pointer initialized to the last elements of the list. The current max area will be initialized to 0.

Therefore the height of the container will be the lower of the two elements at the left and right pointers and the width will be the difference between the right pointer and left pointer.

The function will compute the area between the 2 pointer and compare result with current max area. If the result is greater than current max area, it will update it as the current max area. Thereafter, it compare the height of the 2 pointer and shift the pointer that is shorter [to compensate for the reduction in width, we want to move the pointer that is shorter to a taller line]

Explanation of the codes

I create a class named Solution with a function maxArea which take in a list of integers (height) and return an integer. There are 3 variables, current_max_area (this variable is used to store the current computed max area which is set at 0), left pointer (value set to the first integer position in the list) and right pointer (value set to the last integer position in the list).

class Solution:
    def maxArea(self, height: list[int]) -> int:
        current_max_area = 0
        left = 0
        right = len(height)-1

A while loop is used to determine the max area of the container. The while loop is valid as long the left pointer current position did not meet or move past the right pointer current position. The current area will be determined by the distance between the left and right pointer (width) multiply by the shorter pointer (height)

        while (left < right):
            area = (right - left) * min(height[left], height[right])

The computed area will be compared with the current_max_area, if the computed area is greater, it will be set as the current_max_area.

            if area > current_max_area:
                current_max_area = area

As we reduced the width (that is shifting the pointer inwards), We want to shift the pointer with the shorter height inwards to compensate for the reduction in width. The height of the left and right pointer will be compared and the one that is shorter will be shifted inwards.

Once the while loop exit, the function will return the current_max_area which is the maximum amount of water the container can contained.

            if height[left] < height[right]:
                left += 1
            else:
                right -= 1
                
        return current_max_area

To run the function written above, we will assign values to integer list variable a and instantiate sol as the Solution class. To run the maxArea function, sol.maxArea(a) is used and the print function is used to output the result on our terminal

a = [1,8,6,2,5,4,8,3,7]
sol = Solution()
print(sol.maxArea(a))

Here is the entire code block for reference

class Solution:
    def maxArea(self, height: list[int]) -> int:
        current_max_area = 0
        left = 0
        right = len(height)-1
        
        while (left < right):
            area = (right - left) * min(height[left], height[right])
            if area > current_max_area:
                current_max_area = area
            if height[left] < height[right]:
                left += 1
            else:
                right -= 1
                
        return current_max_area

a = [1,8,6,2,5,4,8,3,7]
sol = Solution()
print(sol.maxArea(a))

link to my Github repo